Net-zero emissions in the buildings sector: Comparing full-system and sectoral models
What does a net-zero emissions buildings sector look like? Is it more cost-effective to invest in heat pumps or expansion of district heating? What differences do sectoral and full-system models envision regarding electrification and heating?
By Ema Gusheva with contributions from Sirin Alibas, Lukas Kranzl and Robert Pietzcker, 30th of October 2023
Both full-system and sectoral energy models envision significant electrification in the buildings sector with electricity doubling as a share of final energy consumption by 2050. However, on average, there is slightly higher electrification in full-system model results compared to sectoral models. Further, especially accentuated by exploring high district heating scenarios, some sectoral models see growth in the use of heat as techno-economically optimal. This result is not shared by full-system models and raises a discussion on how and to what level of detail district heating and its effect on the rest of the energy system is represented in models.
What if we could sit down with Europe’s most advanced modellers and ask them to draw a picture of the most cost-efficient climate neutral energy system for the EU? Every one of them would draw a slightly a different picture. What’s more, some pictures would resemble one another, while others may look completely different. What are the biggest differences between these pictures and why? When do models show different results and why? This is the focus of this series of articles and the second one is dedicated to reaching net-zero emissions in the buildings sector.
The European Climate and Energy Modelling Forum is hosting a model intercomparison exercise for reaching climate neutrality in the EU by 2050. Four full-system models have run a ‘climate neutrality by 2050’ scenario for EU27 with harmonized assumptions and produced projections for techno-economically feasible net zero emissions buildings (see Table 1). At the same time, five sectoral models have run seven scenarios for EU 27 with a CO2 price that corresponds to net-zero targets. Their scenarios vary levels of efficiency, hydrogen, district heating, and electrification (see Table 2). In some instances, this leads to differences among the sectoral models and – subsequently also with the full-system models.
| Model name | Model type | Solution method |
| PRIMES | Full-system | Simulation |
| WITCH | Full-system | Optimization |
| IMAGE | Full-system | Simulation |
| REMIND | Full-system | Optimization |
| REMIND-Buildings | Sectoral | Optimization |
| Invert/EE-Lab | Sectoral | Simulation |
| Invert/Opt | Sectoral | Optimization |
| FORECAST Buildings | Sectoral | Simulation |
| PRIMES-Buildings | Sectoral | Optimization |
Table 1. List of model names and characteristics
| Scenario name | Technology in focus | Efficiency level |
| High Electrification | Efficiency High | Electricity | High |
| High Electrification | Efficiency Moderate | Electricity | Moderate |
| High Electrification | Lifestyle and Behaviour Change | Electricity | Lifestyle and Behavioural Change |
| High District Heating | Efficiency High | District heating | High |
| High District Heating | Efficiency Moderate | District heating | Moderate |
| High H2/e-fuels | Efficiency High | E-fuels/Hydrogen | High |
| High H2/e-fuels | Efficiency Moderate | E-fuels/Hydrogen | Moderate |
Table 2. Description of scenarios ran by sectoral models
There are some findings that full-system and sectoral agree on, like the fact that in 2050 less energy will be spent in this sector compared to 2020 and that that energy will mainly come from electricity and heat as opposed to solids and gases. The focus of this article, however, is on the issues where the results from full-system and sectoral models do not align.
To what extent should the buildings sector be electrified?
Both full-system and sectoral models show a strong increase in the relative share of electricity in final energy use in buildings. In Figure 1 we see that the median value per model type reaches roughly twice the 2020 value by 2050. This suggests doubling of the share of electricity in buildings final energy use at the expense of other carriers. However, there is also a large uncertainty across models and scenarios, with electrification shares spanning the range of 40-80%. This means that there is still much uncertainty about the extent of electrification in 2050 as some model results suggest that the role of electricity in the buildings sector to be higher and others lower.
Beyond this, there are some differences between full-system models and sectoral models. Full-system models show a somewhat higher electricity consumption on average than sectoral models. This is true for both absolute numbers of electricity consumption and for the share of electricity in final energy. It cannot be fully explained away by high-efficiency scenarios in sectoral models or by model outliers. Part of the reason for this is the misalignment in starting values in 2020 as full-system models start with higher absolute values of electricity consumption, but similar values for electricity as a share of final energy.
The mean and median lines for full-system models are not aligned because there is one outlier full-system model (WITCH) with significantly higher values. The range of sectoral model results widens and becomes larger than that of full-system models after 2040. Specifically, the range is from 42%, in the case of FORECAST-Buildings running the High H2/e-fuels Moderate Efficiency scenario, to 90%, in the case of REMIND-Buildings running the High Electrification High Efficiency Scenario. This compares with the results from IMAGE, which show 47% electrification, and WITCH, which shows 81% electrification.
High Electrification Scenarios increase electrification in sectoral models and bring sectoral model results closer to those of full-system models. Similarly, High Efficiency Scenarios bring the results closer together as the mean and median lines are closer together when All Scenarios are included compared to excluding High Efficiency Scenarios.
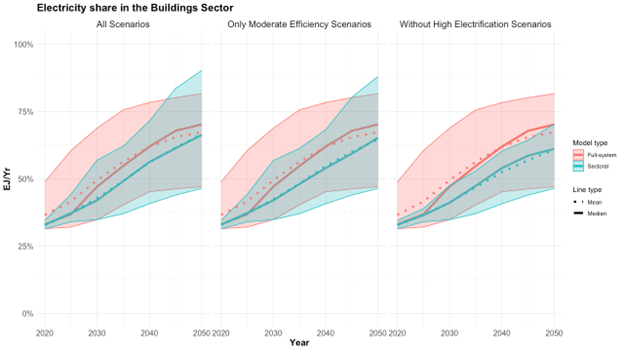
Figure 1. Mean, median and range of electricity as a share of all energy use in the buildings sector
Is it cost-effective to intensify district heating?
Sectoral models project a potentially much larger role for district heating (see Figure 2), which is accentuated by High District Heating scenarios. Without the High District Heating scenarios, the median behaviour is quite similar between sectoral and full-system models, showing a stabilization or slight decrease to roughly 10% of buildings final energy demand.
With the High District Heating scenarios, the median of sectoral models increases to roughly 1.5EJ, or 15% of buildings final energy demand. FORECAST-Buildings stretches the range up high with very high District Heating use of up to 4.5 EJ/yr in 2050. The assumption driving the higher use of heat until 2040 is the potential to densify existing district heating networks and therefore, supply relatively cheaper heat than decentralized heat pumps can provide. After 2040 most model results suggest a stabilization or decline in use of heat due to energy savings driven from efficiency improvements. However, not all modelers see the potential in densifying heating networks. Between themselves, full-system models have a narrower range than the range sectoral models, which suggests that the views of full-system modelers on this issue is more aligned, possibly due to insights regarding the impact of such expansion on the overall energy system.Differences in model results can be further explained by the fact that models have a limited representation of regional granularities like heat densities leading them to differ in the way district heating potentials are calculated and in the result. Further, they may be blind to the heterogeneity of district heating grids in terms of size, temperature levels and supply structure; and to how heat supply feeds back to the overall energy system including the electricity market.
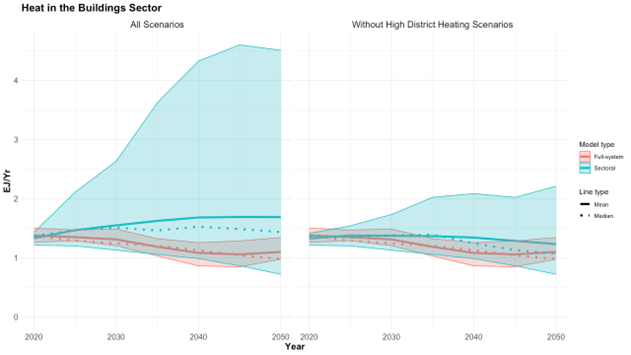
Figure 2. Mean and range of heat in the buildings sector for all scenarios (a) and all scenarios minus High District Heating scenarios for sectoral models (b)
